Lucidchart
Intelligent diagramming platform for real-time collaboration and data visualization
Introduction
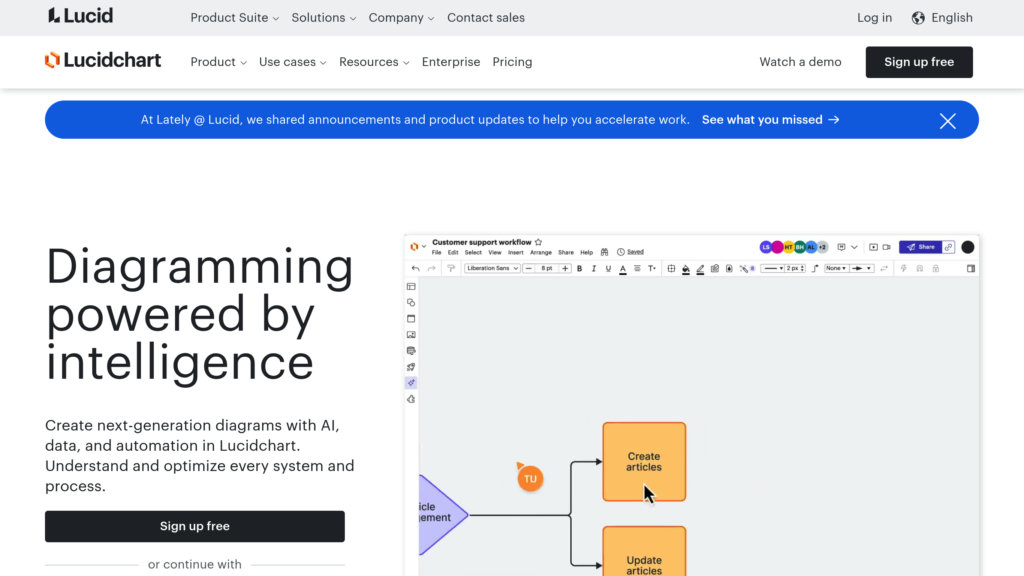
What is Lucidchart?
Lucidchart is a powerful, web-based diagramming application that enables teams to map out intricate systems, workflows, and organizational hierarchies using smart, dynamic visuals. It accommodates numerous diagram formats such as flowcharts, organizational charts, network layouts, UML, and ERDs. The platform incorporates artificial intelligence, data connectivity, and automation to simplify the design and maintenance of diagrams, while offering fluid, synchronous teamwork capabilities on any device. With a vast collection of templates and adaptable shape sets, it is an ideal resource for technical experts, managers, and creative groups seeking to demystify complicated concepts and enhance their decision-making processes.
Key Features:
• AI-Driven Diagram Creation: Utilize artificial intelligence to instantly produce, refine, and condense diagrams, minimizing manual tasks and speeding up project timelines.
• Simultaneous Team Collaboration: Work together in real-time with colleagues via integrated chat, comment threads, and shared cursors for instant communication.
• Data Integration and Auto-Update: Link your diagrams to dynamic data from spreadsheets or databases to display live information and enable automatic refreshes.
• Comprehensive Template and Shape Collections: Choose from a wide array of pre-designed templates and specialized shape libraries for UML, ERD, networking, org charts, and beyond.
• Change Tracking and Version History: Monitor all modifications with a complete revision log and effortlessly restore earlier versions to manage iterations smoothly.
• Connections with Leading Platforms: Integrate effortlessly with Google Workspace, Microsoft Office, Slack, Jira, Confluence, and various other business tools.
Use Cases:
• Process Mapping and Enhancement: Develop detailed process maps and flowcharts to pinpoint bottlenecks, synchronize team efforts, and refine operational efficiency.
• Organizational Structure Design: Construct interactive org charts with integrated data displays to illustrate team composition, capacity, and resource distribution.
• Technical System Documentation: Draft network diagrams, software architectures, and system flows to improve understanding and dialogue within technical teams.
• Visual Project Management: Employ diagrams for project planning, progress monitoring, and supporting Agile and Scrum frameworks with visual task boards.
• Informed Strategy Development: Incorporate real-time data into visualizations to gain immediate insights, supporting data-backed choices and long-term planning.