AI Graph Maker
Create interactive charts and diagrams automatically with flexible export options
Introduction
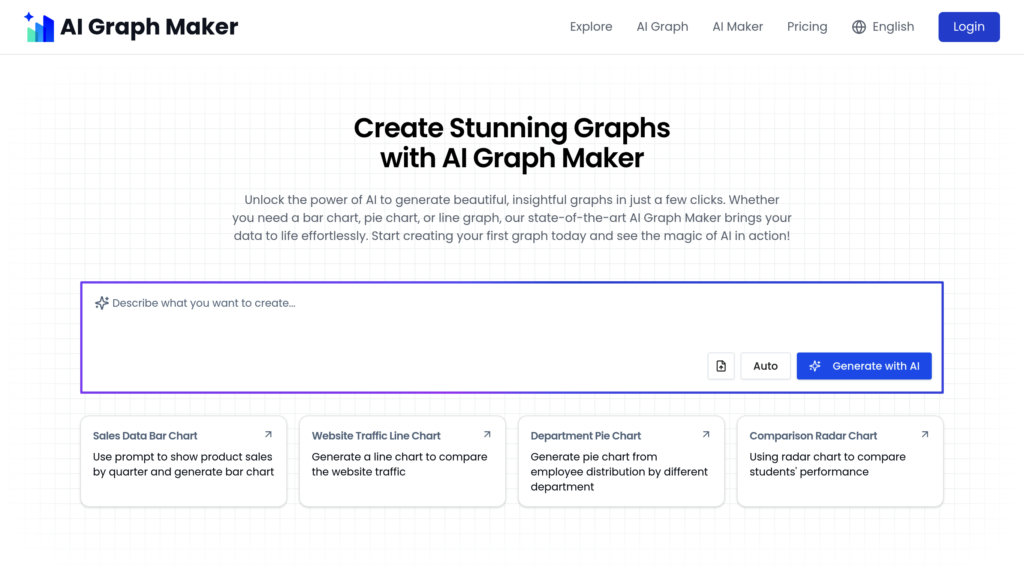
What is AI Graph Maker?
AI Graph Maker is an innovative web-based solution that employs artificial intelligence to produce professional-grade charts and diagrams with remarkable ease. It supports an extensive collection of visualization types including pie charts, bar graphs, flowcharts, Gantt charts, ER diagrams, mind maps, and knowledge networks. The system automates the entire process from data interpretation to graphic generation, delivering polished, customizable results that make data comprehension intuitive. With compatibility for multiple data sources and versatile output formats, it serves professionals in business, academia, research, and project coordination.
Key Features
Intelligent Chart Creation: Utilizes advanced algorithms to analyze provided data and recommend optimal chart types, ensuring precise and effective visual representations.
Comprehensive Visualization Library: Offers an extensive selection of diagram styles from basic charts to complex mind maps and knowledge graphs for every analytical need.
Flexible Design Customization: Provides full control over visual elements including color schemes, typography, labeling, and structural layouts to match brand guidelines or personal preferences.
Versatile Export Capabilities: Allows downloads in high-quality formats such as PNG, SVG, PDF, Mermaid, and Vizmind for easy incorporation into documents, presentations, and digital platforms.
Diverse Data Compatibility: Accepts inputs from various sources including text documents, spreadsheets, PDFs, and web URLs, efficiently converting both structured and unstructured information into meaningful graphics.
Intuitive User Experience: Features a clean, responsive interface with ready-to-use templates and straightforward tools that cater to users of all skill levels.
Use Cases
Academic and Scientific Research: Employ line charts, scatter plots, and knowledge graphs to clearly demonstrate research findings, data trends, and conceptual relationships.
Project Management: Develop Gantt charts and flowcharts to outline project schedules, monitor task progress, and allocate resources efficiently.
Business Intelligence and Reporting: Generate professional charts to display financial metrics, operational KPIs, and business performance indicators for strategic decisions.
Marketing Strategy and Content Development: Create compelling visual content like pie charts and radar diagrams to showcase market research, audience demographics, and competitive landscape.
Software Architecture and System Design: Construct ER diagrams and mind maps for database planning, system workflow analysis, and idea organization during development phases.