PicDoc
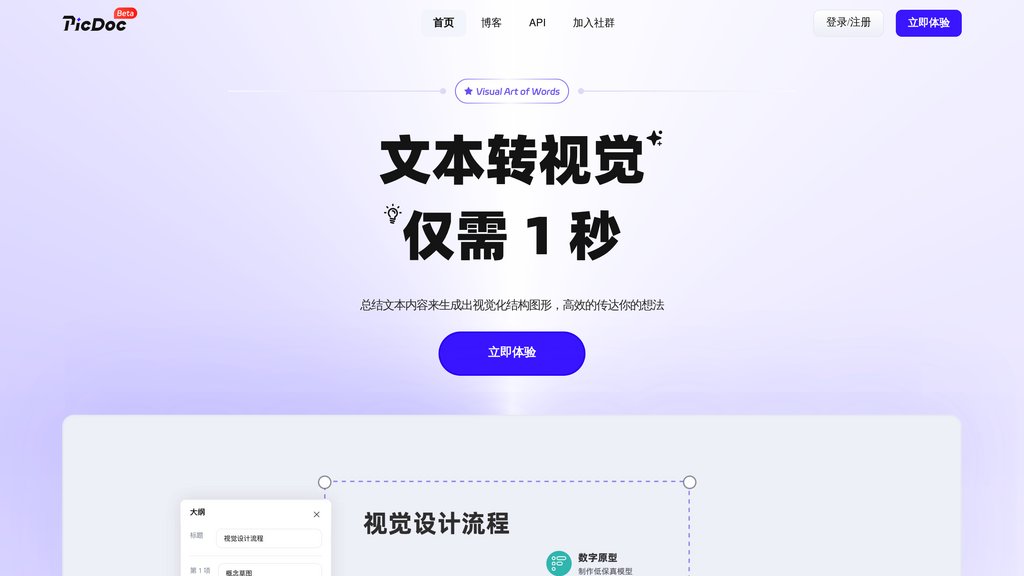
Transform text to charts and infographics automatically with smart editing
Introduction
What is PicDoc?
PicDoc serves as an advanced text-to-visualization engine that effortlessly converts written material into sophisticated charts, flowcharts, mind maps, and infographics. Bridging the gap between textual and visual communication, the platform accelerates the transformation of intricate concepts into clear visual formats. Users can provide content through various methods such as direct text input, document uploads (PDF/Word/images), or automated content creation from keywords. The system's intelligent engine examines textual relationships and organizational patterns to produce fitting visual outputs, ranging from procedural sequences to analytical comparisons, serving diverse needs from corporate reporting to academic instruction.
Key Features:
• Utilizes deep semantic analysis technology that examines text composition and automatically produces corresponding visual diagrams including workflow charts, funnel visualizations, and comparative graphics.
• Offers multiple content submission channels supporting direct text input, document imports (PDF/Word/images), and keyword-triggered content creation for complete workflow adaptability.
• User-friendly editing interface enabling real-time adjustments to text components and graphic elements, featuring extensive style collections across corporate, technical, and creative themes.
• Flexible output options supporting PNG, PPT, PDF formats with seamless integration into Word, PowerPoint, and live presentation functionalities.
• Effortless distribution system generating accessible URLs for immediate content access without requiring recipients to download software or create accounts.
Use Cases:
• Business professionals and analysts can rapidly transform detailed reports and operational procedures into polished visual presentations for executive meetings and stakeholder updates.
• Academic instructors and training specialists can convert theoretical concepts and educational content into captivating visual resources that boost understanding and knowledge retention.
• Organizational teams can diagram operational processes, procedural guidelines, and system workflows by converting text-based documentation into clear process maps and flow diagrams.
• Data specialists can translate statistical findings and quantitative relationships into persuasive infographics and analytical charts for enhanced data narrative.
• Marketing professionals and social media creators can amplify written content with visual enhancements, producing more dynamic materials for digital campaigns and content marketing.
