Piktochart
Create professional infographics and presentations easily online
Introduction
Piktochart: An Overview
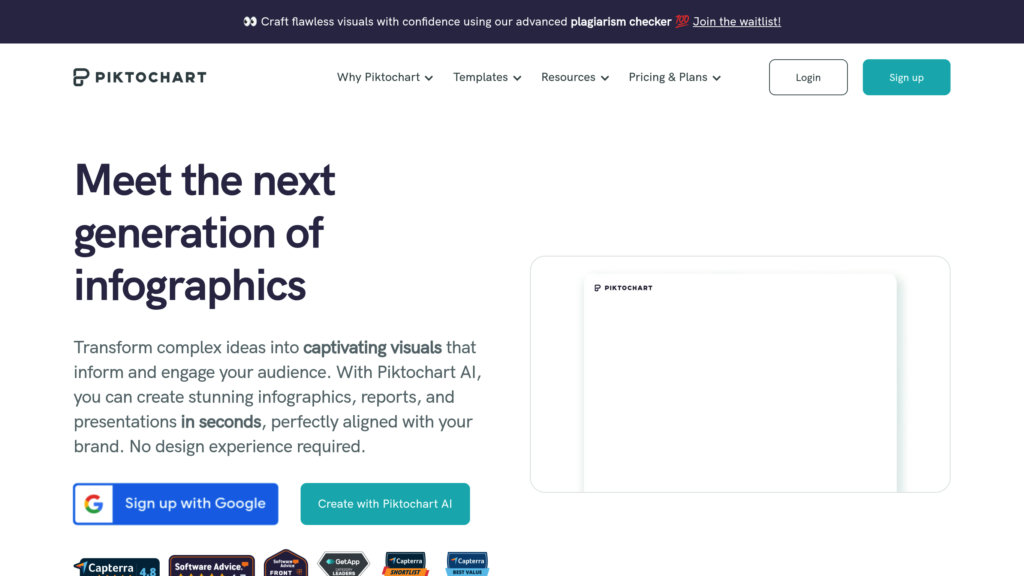
Piktochart is a dynamic and flexible solution designed to convert intricate information into captivating visual content, including infographics, presentations, and detailed reports. It boasts an extensive collection of ready-made templates, deep customization capabilities, and collaborative features, ensuring it is suitable for novices and seasoned designers alike. The platform facilitates smooth integration with applications such as Google Sheets for easy data incorporation and allows for exporting in multiple formats.
Core Capabilities
Infographic Creation
Develop compelling infographics by leveraging a rich selection of adaptable templates and an extensive asset library.
Data Visualization
Generate and tailor interactive charts, graphs, and maps to present complex data in a clear and digestible manner.
Team Collaboration
Enable teamwork by inviting colleagues to co-create and edit visuals in shared workspaces, streamlining the design process.
Multi-Device Compatibility
Guarantee that your creations display perfectly across all screens, from smartphones and tablets to desktop computers.
AI-Enhanced Tools
Harness artificial intelligence to produce images from textual descriptions and accelerate the development of polished visuals.
Practical Applications
Marketing and Promotion: Designers and marketers can produce attractive social media graphics and promotional content to strengthen brand visibility.
Business Intelligence: Corporate professionals can generate visually impactful reports and presentations to convey key insights with clarity.
Educational Resources: Educators can design informative infographics to simplify complex topics, improving student engagement and learning outcomes.
Content Adaptation: Efficiently manage and transform existing content, such as converting lengthy reports into concise, visual infographics.
