Graphy
Create interactive charts and dashboards automatically from your data
Introduction
What is Graphy?
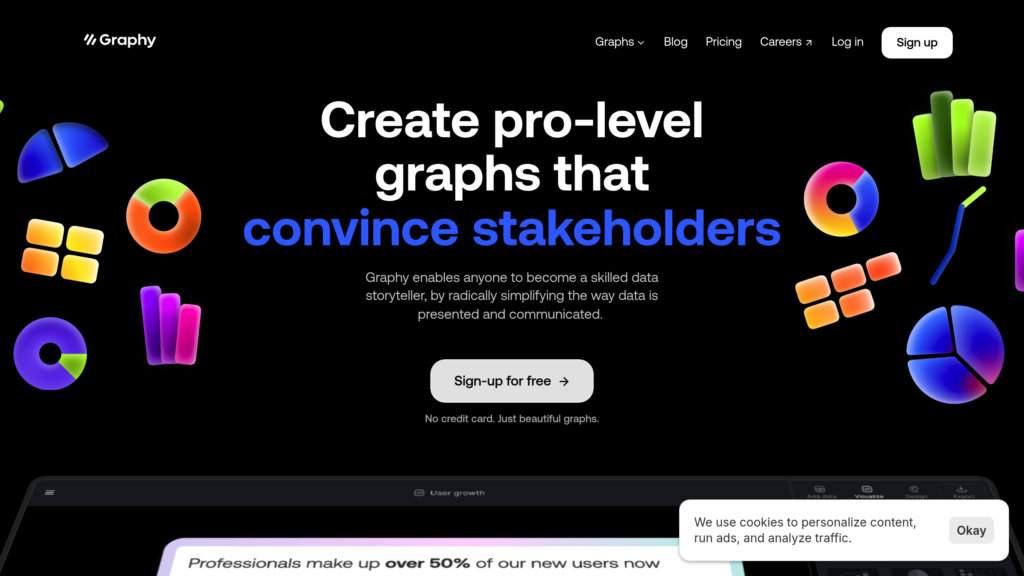
Graphy is a cutting-edge data visualization platform that streamlines the creation of professional charts and dashboards. By harnessing artificial intelligence, it produces insightful visuals to help data-centric teams convey information clearly and base choices on solid evidence. Featuring a no-code, user-friendly interface, Graphy allows immediate data import from diverse sources, extensive customization, and teamwork-friendly sharing capabilities. Its emphasis on data-driven storytelling makes it perfect for groups requiring rapid, visually impressive, and practical reports.
Key Features
AI-Powered Visualization and Analytics
Utilizes advanced AI to examine datasets and suggest optimal chart styles and visual refinements for enhanced clarity.
Effortless Data Connectivity
Enables quick data ingestion from platforms such as Google Sheets and simple paste operations, removing tedious manual input.
Dynamic and Adaptable Charts
Allows building of engaging graphs with adjustable colors, typography, labels, and notes to emphasize critical findings.
Teamwork and Distribution
Supports simultaneous collaborative work and straightforward sharing via embedded codes, live links, or image exports.
User-Centric No-Code Design
Built for accessibility across all proficiency levels with a straightforward, speedy interface that demands no coding skills.
Advanced Narrative Capabilities
Incorporates tools like graphical annotations, trend indicators, and target lines to craft persuasive and actionable data stories.
Use Cases
Business Intelligence: Develop lucid and influential reports to share performance indicators and patterns with decision-makers.
Marketing Analysis: Illustrate promotional data and consumer behavior to refine tactics and showcase return on investment.
Collaborative Analysis: Exchange interactive dashboards among team members for collective review and accelerated outcomes.
Academic Visualization: Assist teachers and learners in presenting intricate information in an accessible and captivating manner.
Product Development: Monitor key metrics and user input graphically to guide feature updates and enhancements.
