Text2Infographic
Automatically transform text into professional infographics in minutes
Introduction
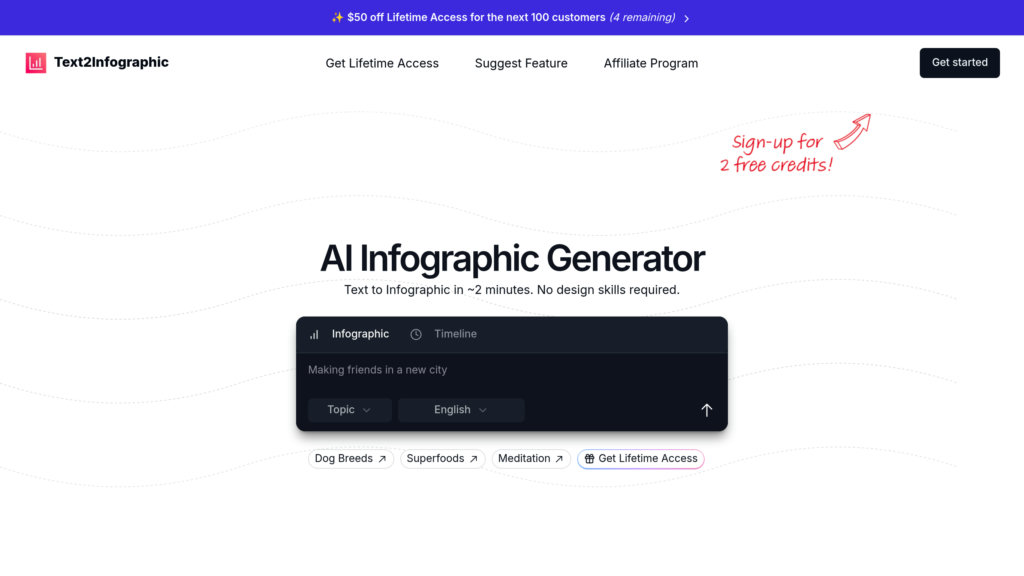
What is Text2Infographic?
Text2Infographic is an intelligent platform that uses artificial intelligence to convert written materials—including blog articles, documents, and spreadsheets—into captivating infographics swiftly. It streamlines the process of identifying key insights and visualizing data, allowing users of all skill levels to produce professional graphics that improve communication and captivate audiences. The platform is multilingual, offers deep customization for brand alignment, and features a simple one-time purchase that includes lifetime access and updates.
Key Features
AI-Driven Design Creation
Leverages advanced AI to intelligently parse text, identify core messages, and instantly produce a variety of infographic styles.
Flexible Input Sources
Accepts content from diverse formats such as website links, text documents, and spreadsheet files (e.g., Word, Google Docs, Excel).
Personalization and Brand Control
Enables full customization of visual elements like color schemes, typography, logos, and overall structure to maintain brand consistency.
Integrated Research and Attribution
Features AI-based content enrichment by gathering relevant information and automatically generating source citations.
Global Language Compatibility
Functions seamlessly in more than 20 languages, ensuring wide accessibility for an international user base.
Lifetime License with Ongoing Upgrades
A single payment provides unlimited usage, complete commercial rights, and access to all future enhancements.
Use Cases
Content Marketing : Enables marketers to instantly repurpose articles and reports into shareable infographics for digital campaigns and social channels.
Educational Resources : Helps educators and trainers distill complicated subjects into clear, visually stimulating learning materials.
Corporate Reporting : Assists business professionals in elevating reports and presentations with custom data visualizations.
Social Media Engagement : Allows social media strategists to generate attractive graphics that increase interaction on networks like LinkedIn and Instagram.
Organizational Communication : Aids companies in conveying internal data and strategies effectively to employees and stakeholders through clear visuals.