Sourcetable
Smart spreadsheet platform: automate data analysis and connect 100+ sources
Introduction
What is Sourcetable?
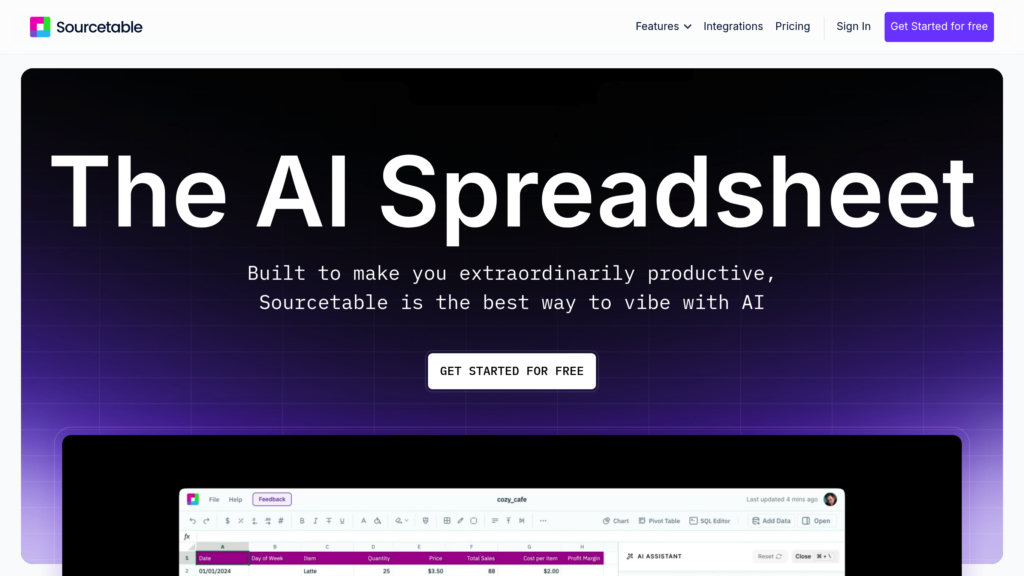
Sourcetable is a next-generation AI-driven spreadsheet and data analysis platform engineered to significantly enhance efficiency. It automates intricate data tasks like cleansing, formula creation, chart building, and merging information from diverse sources. Marrying the ease of use of classic spreadsheets with intelligent automation and natural language processing, it empowers users to effortlessly explore large datasets, uncover valuable insights, and design interactive charts. With live connections to more than 100 data sources and databases, it provides a contemporary, team-oriented workspace for business intelligence, reporting, and informed decision-making.
Key Features:
• Intelligent Spreadsheet Automation: An AI helper comprehends commands in plain language to automate formula writing, data purification, and multi-stage processes.
• Unified Data Connectivity: Syncs live information from a massive library of over 100 apps and databases (e.g., MySQL, PostgreSQL, MongoDB, Stripe, Quickbooks) for up-to-the-minute accuracy.
• Sophisticated Data Visualization: Instantly produces engaging, customizable charts and graphs from your data, even supporting advanced types like Python-based box plots.
• Versatile Query Methods: Accommodates both simple natural language questions and powerful SQL editing, serving users of all technical skill levels.
• Massive Data Capacity: Efficiently handles enormous files exceeding 10GB, allowing analysis of vast datasets without the constraints of conventional spreadsheet software.
• Team Collaboration with Live Data: Facilitates teamwork on interconnected spreadsheets with near-instant data and model refreshes, supercharging collaborative reporting and analysis.
Use Cases:
• Business Reporting and Analytics: Streamline the analysis of financial, sales, and marketing data by automatically syncing live information from various platforms to produce insightful reports.
• Data Cleansing and Preparation: Rapidly refine, enhance, and reshape raw data using AI, minimizing manual effort and boosting data quality.
• Interactive Dashboard Development: Create vibrant, persuasive dashboards featuring AI-crafted visualizations for compelling presentations and strategic planning.
• Cross-Platform Data Consolidation: Bring together information from databases, SaaS applications, and CSV files into a single, unified spreadsheet for holistic analysis.
• Technical and Scientific Data Analysis: Utilize support for multi-dimensional data and complex formulas for demanding analyses in fields like finance, spatial studies, or research.
