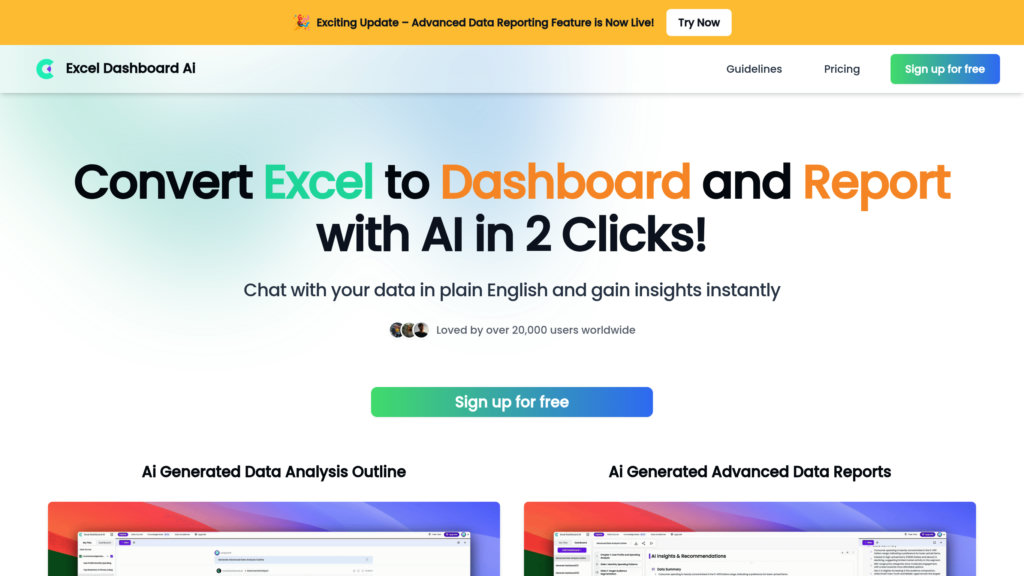
ExcelDashboard AI
Turn Excel spreadsheets into interactive dashboards with natural language commands
Introduction
What is ExcelDashboard AI?
ExcelDashboard AI serves as a smart data companion, effortlessly converting raw Excel information into vibrant, interactive dashboards and in-depth analytical reports. With minimal effort, users can create various analytical views, tailor dashboards using everyday English, and generate polished, customizable reports. Supported by Microsoft for Startups Founders Hub, it is built for everyone from beginners to experts, simplifying data visualization and speeding up insight discovery without the need for programming knowledge.
Key Features
Instant Dashboard Creation
Transform Excel data into engaging, interactive dashboards in just two clicks, with automated chart creation and visual presentation.
Natural Language Data Interaction
Communicate with your data using simple English questions and commands to get instant, meaningful insights.
Multi-Dimensional Batch Analysis
Quickly produce and adjust up to 10 distinct analytical perspectives to examine your data from various angles.
Comprehensive Editable Reports
Create thorough reports featuring fully customizable charts from your dashboards, ideal for sharing and presentations.
AI-Powered Insight Interpretation
The AI explains chart significance and emphasizes crucial data points, making complex information easy to grasp.
Flexible Subscription Plans
Choose from free and paid tiers with different levels of AI credits, file upload capacities, and advanced features to match diverse requirements.
Use Cases
Business Data Analysis: Enable professionals to swiftly turn Excel data into practical dashboards and reports for informed decision-making.
Marketing Performance Tracking: Help marketers visualize key metrics and conduct multi-faceted analysis to gauge campaign success.
Operations and Financial Reporting: Allow operations and finance teams to automate reporting and easily investigate data patterns.
Educational and Personal Projects: Assist students and individuals in managing data analysis and creating clear visual summaries without technical skills.
Data Exploration via Natural Language: Empower users to discover insights by asking simple questions in English, eliminating manual formula work.