Draxlr
No-code BI platform for SQL data visualization and automated insights
Introduction
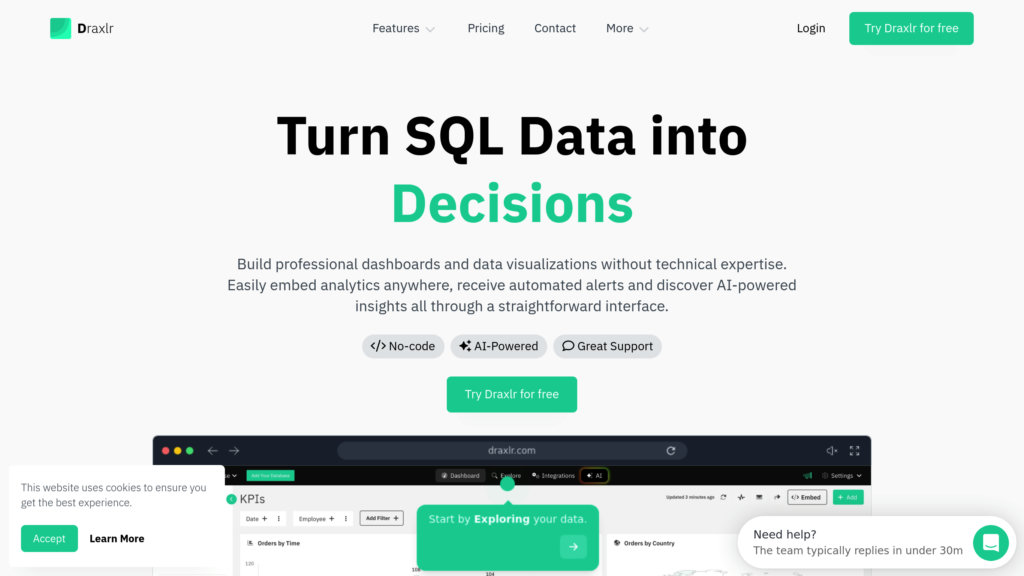
What is Draxlr?
Draxlr is an accessible business intelligence platform that allows users to analyze, visualize, and track SQL database information without any programming knowledge. It provides a visual query constructor, various visualization options, personalized dashboard creation, and instant notifications through email or Slack. The platform enables integration of dynamic dashboards into applications or websites, supporting multi-tenant architecture and white-label customization. By incorporating artificial intelligence for query formulation and analytical discoveries, Draxlr helps organizations accelerate data-informed decision-making while minimizing developer dependency. This economical solution caters to both technical professionals and business users.
Key Features:
• Visual Query Construction: Create sophisticated SQL queries through an intuitive drag-drop interface, with flexibility to directly edit raw SQL when needed.
• Personalized Dashboards: Design tailored monitoring interfaces with multiple visualization styles, data filters, and live updates to track essential business indicators.
• Smart Alert System: Configure automated notifications for important data fluctuations or threshold breaches delivered through email and Slack integration.
• Embedded Analytics: Integrate fully customizable, responsive dashboards into client applications or digital platforms with multi-tenant functionality.
• AI-Enhanced Analytics: Utilize artificial intelligence to automatically create database queries and reveal valuable business intelligence from datasets.
• Collaboration and Export: Distribute dashboards through shareable links, convert data into CSV/Excel files, and save visualizations for reporting purposes.
Use Cases:
• Business Intelligence Exploration: Enable non-technical staff to independently investigate SQL datasets to address operational inquiries.
• Team Performance Tracking: Develop specialized dashboards for different departments to oversee key performance indicators with tailored perspectives.
• Live Metric Surveillance: Continuously observe crucial business metrics and get instant notifications about important data developments.
• Client Analytics Integration: Incorporate interactive data visualizations into software products to offer customers embedded analytical capabilities.
• Insight Distribution: Efficiently communicate findings with relevant parties and export information for presentations or additional examination.